Table of Contents
Abstract
While we focus on the aerobic processes of gross primary production (GPP) and ecosystem respiration (ER) to parameterize stream metabolism, we also know that anaerobic, energy-releasing processes are common in streams. Denitrification, which releases just 5% less free energy than aerobic respiration, is one such process. We ask: are anaerobic energy-generation pathways significant contributors to stream energy budgets? We measured denitrification (acetylene block) and aerobic metabolism in 25 study streams in the USA (NEON n=13, StreamPULSE n=12), modeling GPP and ER using a one or two-station inverse Bayesian approach. This dataset was supplemented with denitrification (15-N tracer) and metabolism from LINXII (n=28). Areal denitrification and ER rates were converted to rates of energy release using Gibbs free energy values. Total energy released was calculated as free energy from denitrification plus ER. Linear, nonlinear, and tree-based regression models, where the best fit model was determined by testing set performance, were used to determine which environmental variables were most important to predicting the proportion of the total energy budget released via denitrification. Preliminary results show denitrification contributing to as much as 9.6% of the total energy budget of a single stream.
Introduction
Stream metabolism = Energy stored - energy released
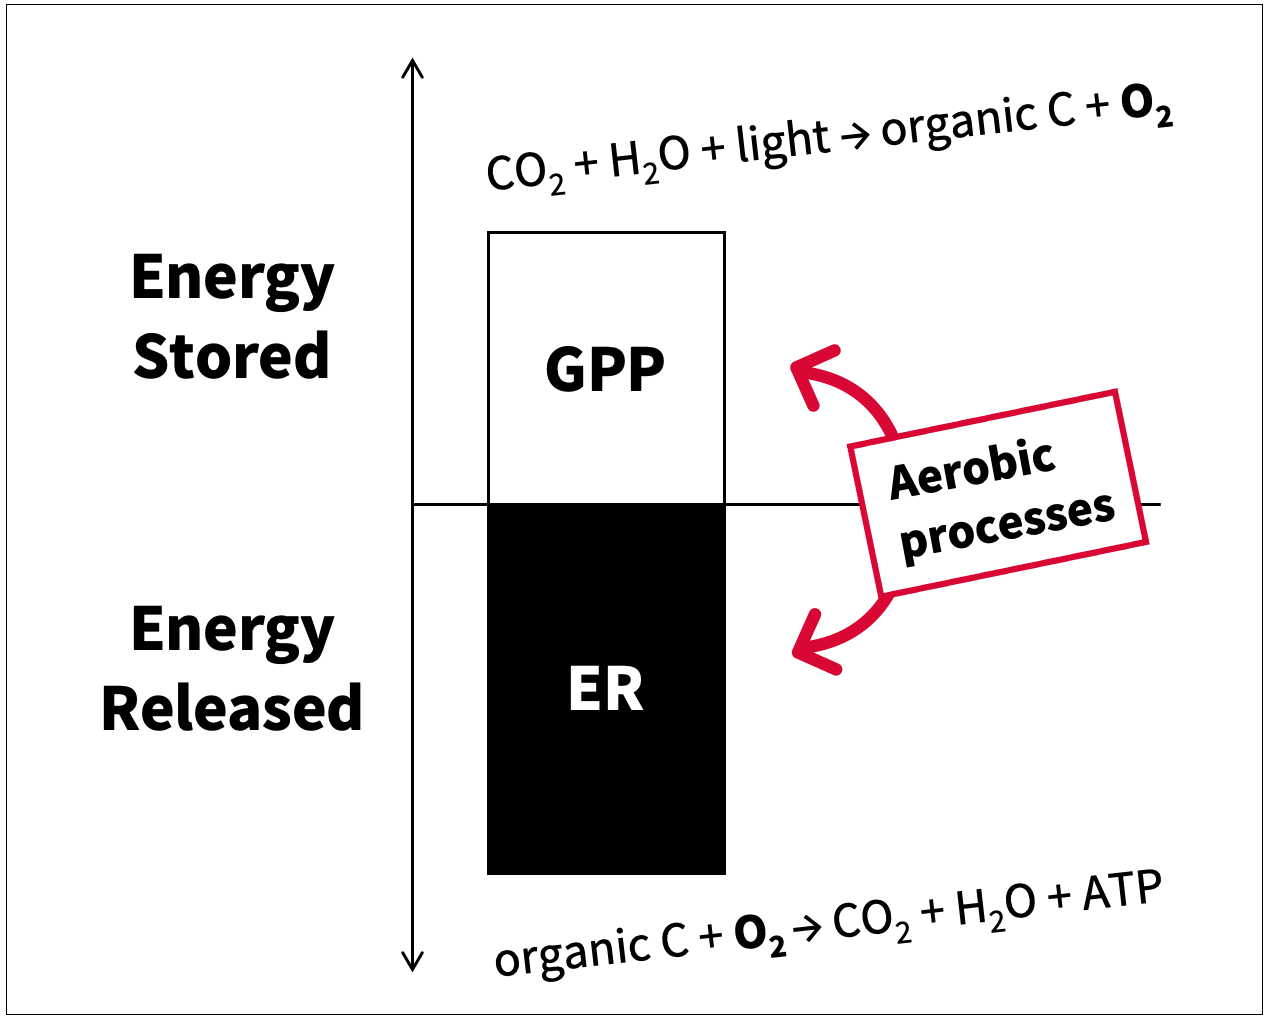
Figure 1: Generally, we conceptualize stream metabolism as the balance between energy storage through gross primary production (GPP) and energy release through ecosystem respiration (ER).
What about anaerobic processes?
![We know that the denitrification activity is common in freshwater ecosystems. Figure from Mulholland et al. 2008[@mulholland2008], showing denitrification uptake rates (Uden) in reference (Ref), agricultural (Agr), and urban (Urb) streams from the LINX II study compared to denitrification uptake rates in other rivers, lakes, estuaries, and oceans.](images/Slide4a.png)
Figure 2: We know that the denitrification activity is common in freshwater ecosystems. Figure from Mulholland et al. 2008(Mulholland et al. 2008), showing denitrification uptake rates (Uden) in reference (Ref), agricultural (Agr), and urban (Urb) streams from the LINX II study compared to denitrification uptake rates in other rivers, lakes, estuaries, and oceans.
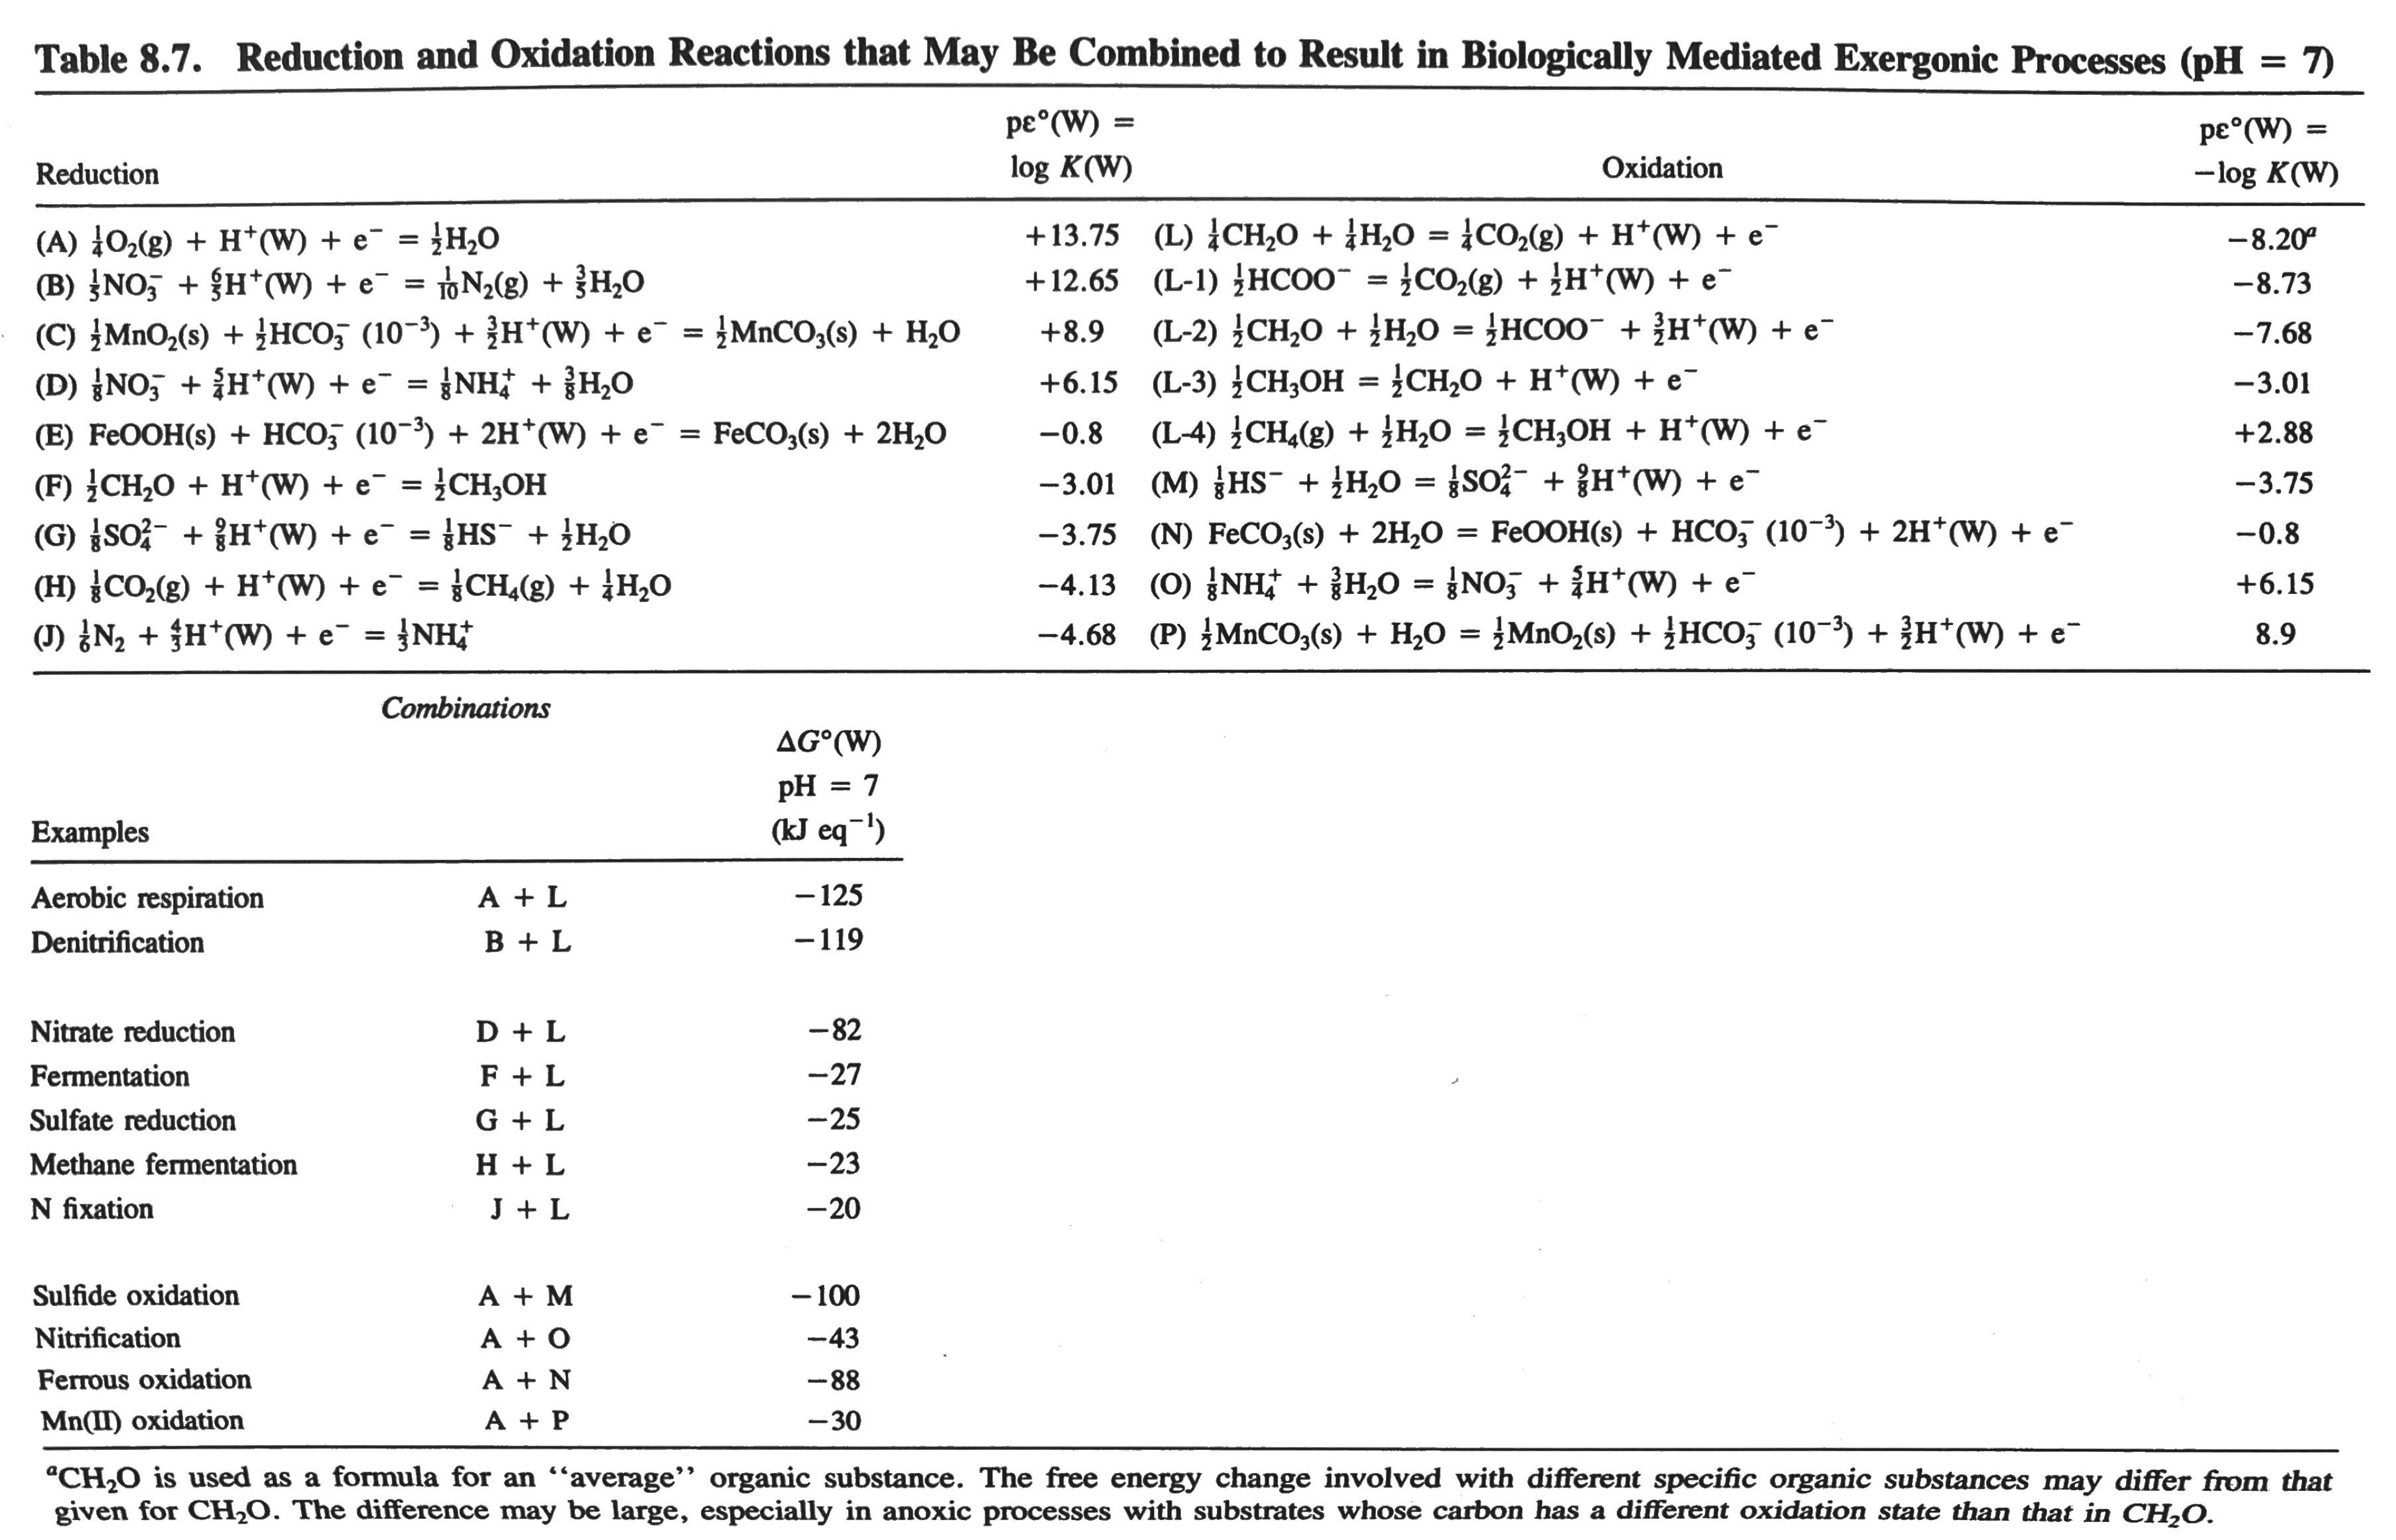
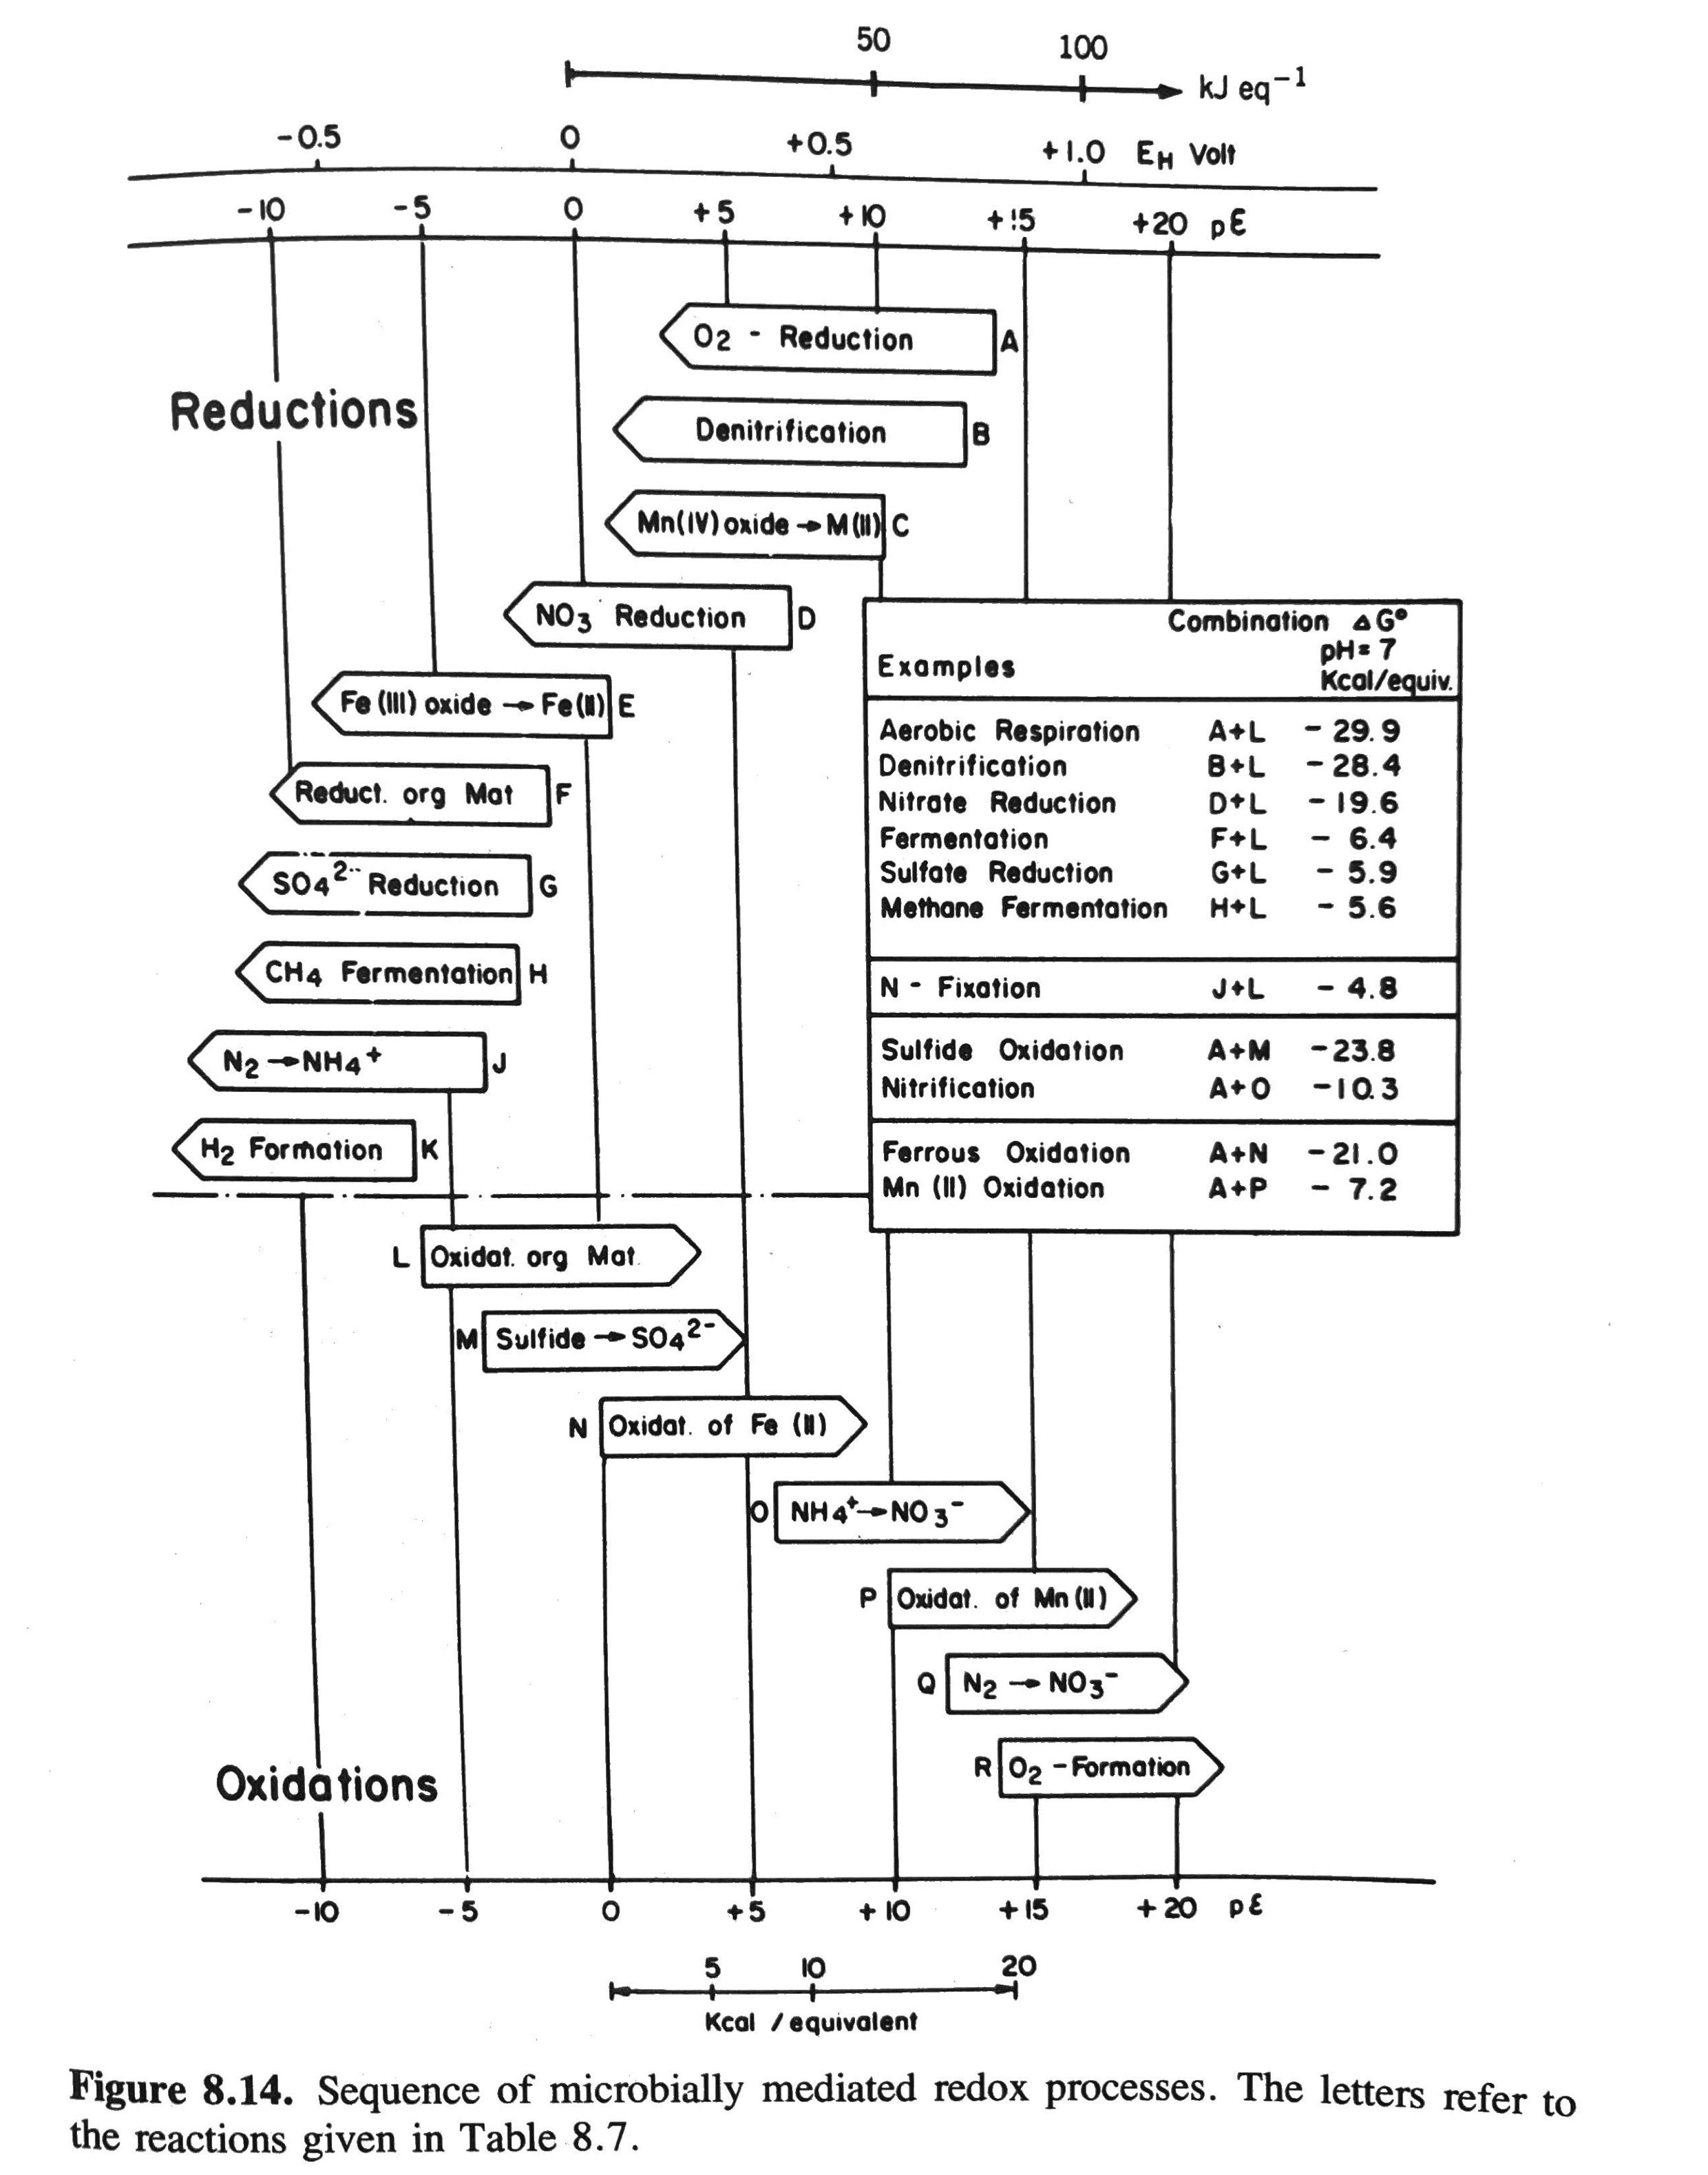
![We also know that denitrification releases just 5% less free energy than aerobic respiration per electron in reaction.[@stumm_aquatic_1996]](images/Slide4b.png)
Figure 3: We also know that denitrification releases just 5% less free energy than aerobic respiration per electron in reaction.(Stumm and Morgan 1996)
Therefore, we ask: Are anaerobic processes significant contributors to stream energy budgets?
Methods
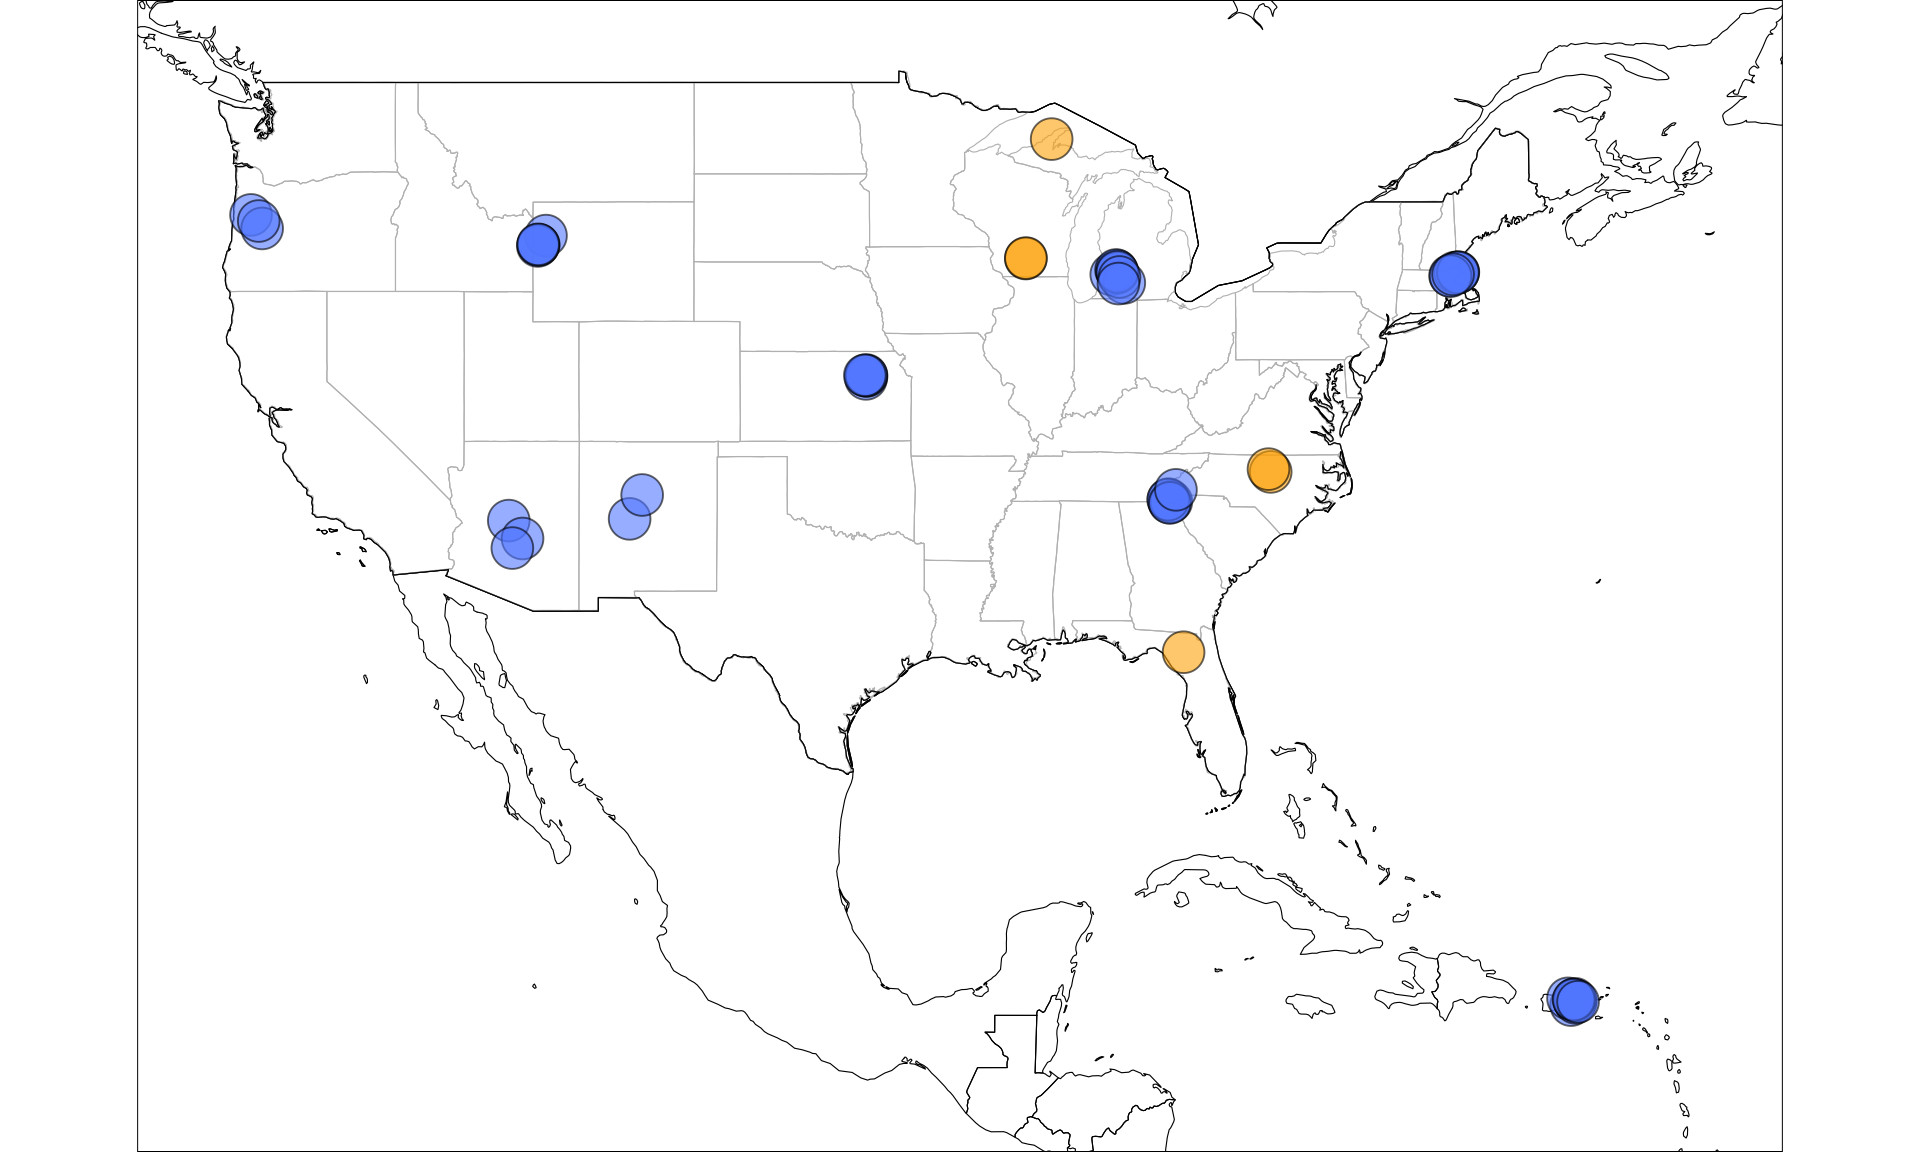
Figure 4: Map of Marcarelli Nationwide Survey (n = 7), and LINXII (n = 48) study sites used in this analysis. Yellow = Marcarelli Nationwide site, blue = LINXII site.
Sites and data
LINX II project
Whole-stream denitrification rates, measured using 15-N tracer (as \(k_{den}\), \(m^{-1}\)), were obtained from Mulholland et al. (2009) appendix. Rates were then converted to areal denitrification rates using conversion steps outlined in the methods of Mulholland et al. (2009), where \(k_{denT}\) = denitrification rate per unit time (\(d^{-1}\)), \(v\) = average water velocity (\(cm ~ s^{-1}\)), \(v_{fden}\) = denitrification uptake velocity (\(cm ~ s^{-1}\)), \(Q\) = discharge (\(L ~ s^{-1}\)), \(w\) = average stream wetted width (\(m\)),\(U_{den}\) = areal denitirification rate (\(mg ~ m^{-2} ~ hr^{-1}\)), \(C\) = ambient nitrate concentration (ug-N \(L^{-1}\)).
\[ k_{denT} = k_{den} \times v \times 864 \]
\[ v_{fden} = \frac{Q}{w} \times k_{den} \times 0.1 \]
\[ U_{den} = v_{fden} \times C \times 36 \]
Modeled metabolism (gross primary production, ecosystem respiration) for streams in the LINX II project was obtained from Bernot et al. (2010) supplemental information.
Marcarelli nationwide denitrification and N fixation survey
Denitrification was measured on individual stream substrates using amended acetylene inhibition assays.
Modeled metabolism obtained from StreamPULSE repository, https://data.streamPULSE.org.
Energy budget calculation
Process rates (ex. denitrification in mg-N \(m^{-2} ~ hr^{-1}\)) were converted to energy production rates (kCal \(m^{-2} ~ hr^{-1}\)) using Gibbs free energy (\(\Delta G\)) values and molar conversion factors from the balanced chemical reactions of each process (Stumm and Morgan 1996).
Aerobic respiration
Energy released from ER = ER rate \(\times ~ \Delta G_{0}' ~ \times ~ e^{-}\) in balanced reaction
Where ER rate is in \(g~O_{2}~m^{-2}~d^{-1}\), and Gibbs free energy or \(\Delta G_{0}'\) is in \(kCal~e^{-1}\). Applying unit conversions, where there are 32 \(g~O_{2}~mol~O_{2}^{-1}\), 2 mol O per mol \(O_{2}\), 1 mol \(O_{2}\) per balanced reaction, and 24 hours per day, this becomes energy released from ER in kCal \(m^{-2} ~ hr^{-1}\):
Energy released from ER = ER rate \(\times\) 29.9 \(\times\) 4 \(\div\) 32 \(\times\) 2 \(\div\) 24
Denitrification
Energy released from denitrification = Denitrification rate \(\times ~ \Delta G_{0}' ~ \times ~ e^{-}\) in balanced reaction
Where denitrification rate is in \(mg~N~m^{-2}~hr^{-1}\), and \(\Delta G_{0}'\) is in \(kCal~e^{-1}\). Applying unit conversions, where there are 1000 mg per g, 14 \(g~N~mol{-1}\), and 2 mol N per balanced reaction, this becomes energy released from denitrification in kCal \(m^{-2} ~ hr^{-1}\):
Energy released from denitrification = Denitrification rate \(\times\) 28.4 \(\times\) 10 \(\div\) 1000 \(\div\) 14 \(\div\) 2
Predictive modeling approach
Pre-processing
- Dummy variables for categorical predictors
- Removed near zero variance predictors, cutoff ratio = 95/5
- Centered, scaled
Splitting and resampling
- Data randomly split into training and testing sets, 80% training and 20% testing
- 10-fold cross-validation for resampling, repeated 10 times
Evaluating model performance
- Best fit model determined by the lowest root mean squared error (RMSE) on testing set
Pre-processed LINX II dataset
- 28 observations, 28 predictors
- 8 categorical (ex. state, land use, biome)
- 20 continuous (ex. discharge, reach width, DOC, NO3, SRP, GPP, ER)
- 8 categorical (ex. state, land use, biome)
- Response: Energy released from denitrification as a proportion of total energy (%)
Results and discussion
Denitrification as a proportion of total energy
- Streams with low denitrification rates could still depend on energy generated by denitrification.
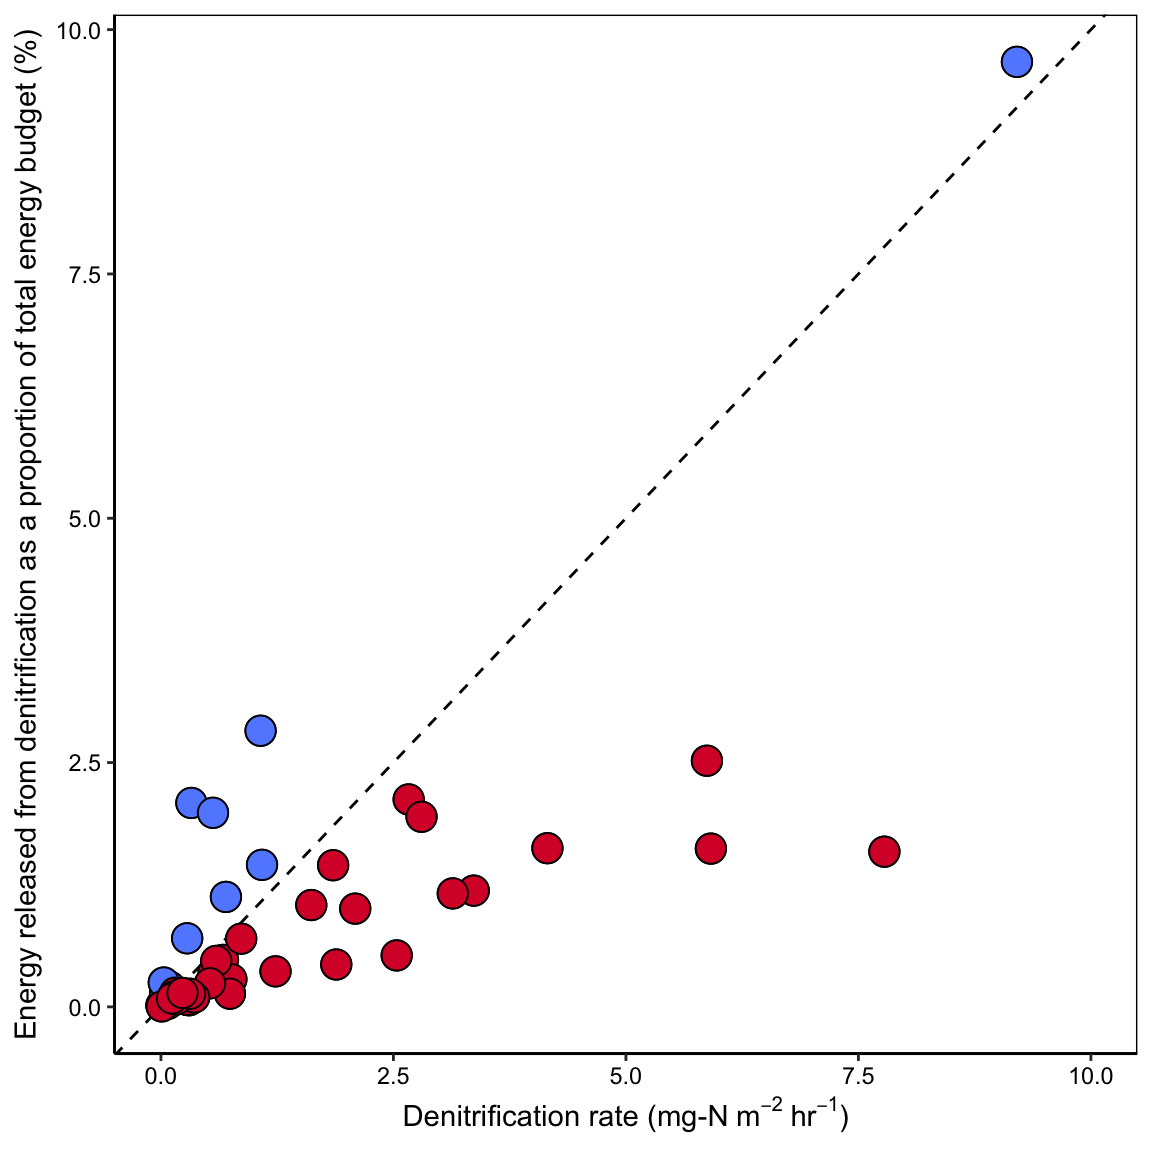
Figure 5: LINX II streams with ‘low’ denitrification rate may still source a significant portion of their energy from denitrification, when total energy is considered as Gibbs free energy produced through denitrification plus Gibbs free energy produced through ecosystem respiration. Dashed line has a slope of 1, representing a denitrification rate proportional to the fraction of total energy released from denitrification. Blue points represent sites where the energy contribution from denitrification is greater than expected, red points represent sites where the energy contribution from denitrification is less than expected.
Predictive modeling
- [Nitrate] important factor in controlling energy production from denitrification.
| PLS | Elastic net | Neural net | MARS | Radial SVM | KNN | Random forest | Boosted trees | |
|---|---|---|---|---|---|---|---|---|
| RMSE | 0.548 | 0.423 | 0.526 | 0.394 | 0.507 | 0.530 | 0.493 | 0.518 |
| Rsquared | 0.125 | 0.572 | 0.724 | 0.837 | 0.023 | 0.022 | 0.040 | 0.036 |
| MAE | 0.525 | 0.345 | 0.506 | 0.299 | 0.405 | 0.513 | 0.431 | 0.482 |
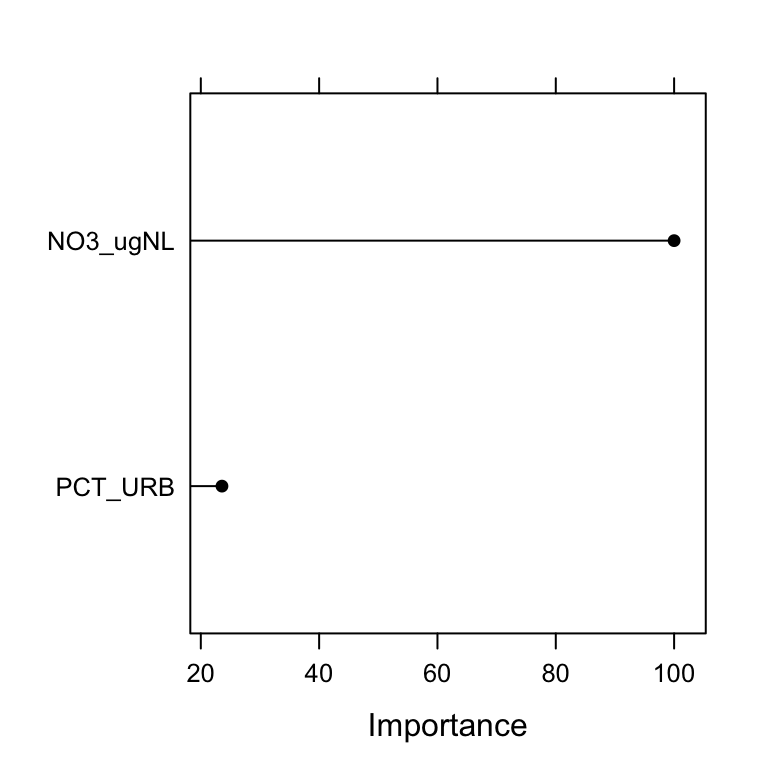
Figure 6: Most important predictors for best fit model (MARS) predicting denitrification proportion of energy budget (%) in LINX II streams.
Breakdown by substrate
- Substrate with highest rates of denitrification may be contributing the least amount to total energy budget.
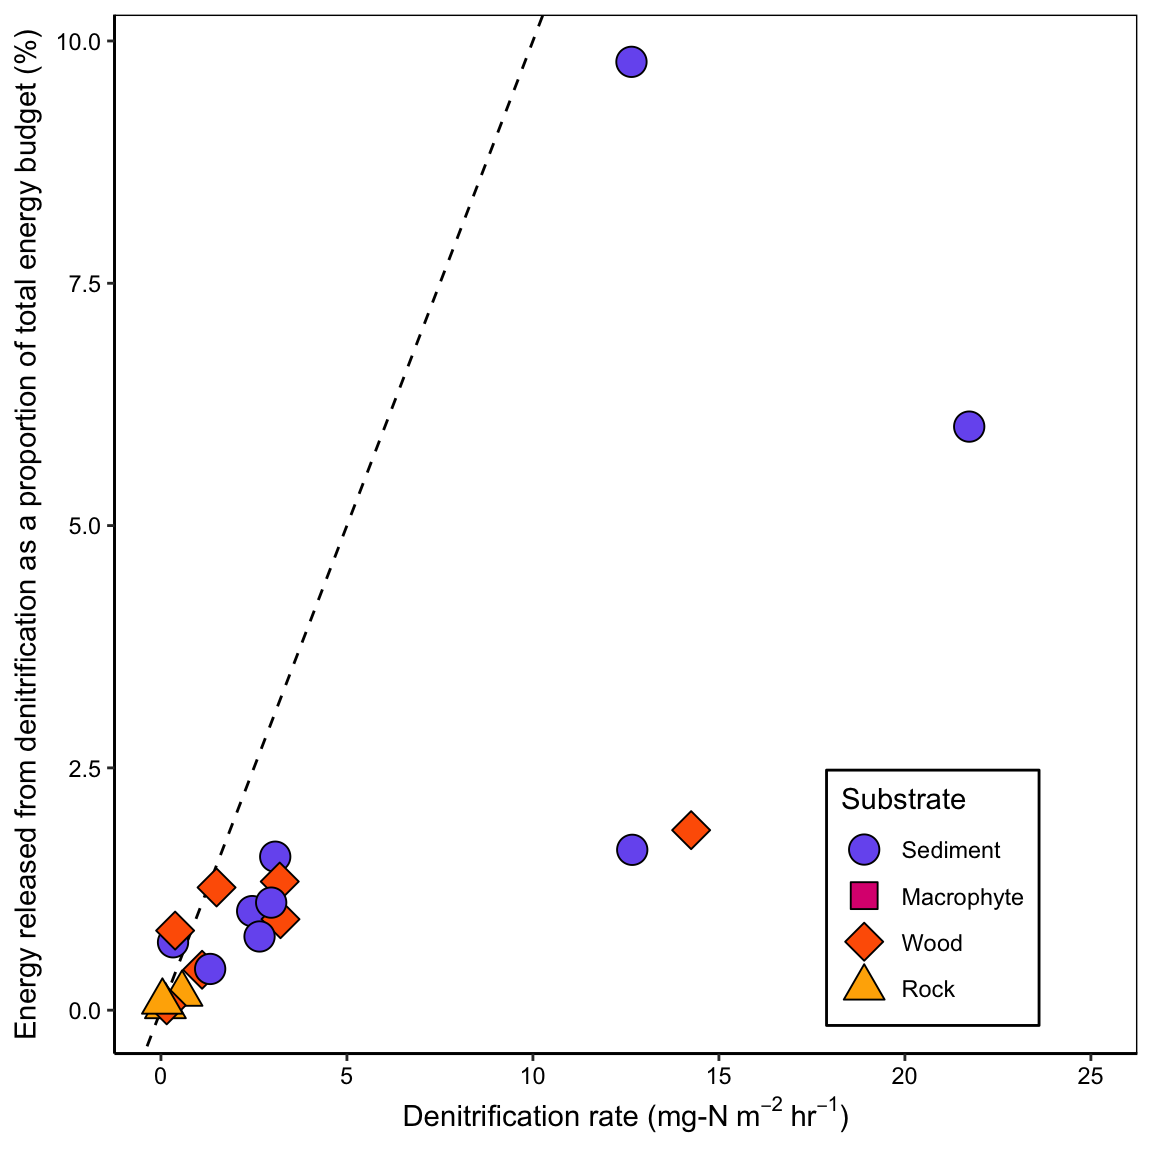
Figure 7: Substrates with the highest rates of denitrification may be contributing the least amount to the total energy budget. Dashed line has a slope of 1, representing a denitrification rate proportional to the fraction of total energy released from denitrification. Energy released from denitrification is based on amended denitrification rates. Data is from a subset of 7 streams from the Marcarelli Nationwide Survey (total n = 21).
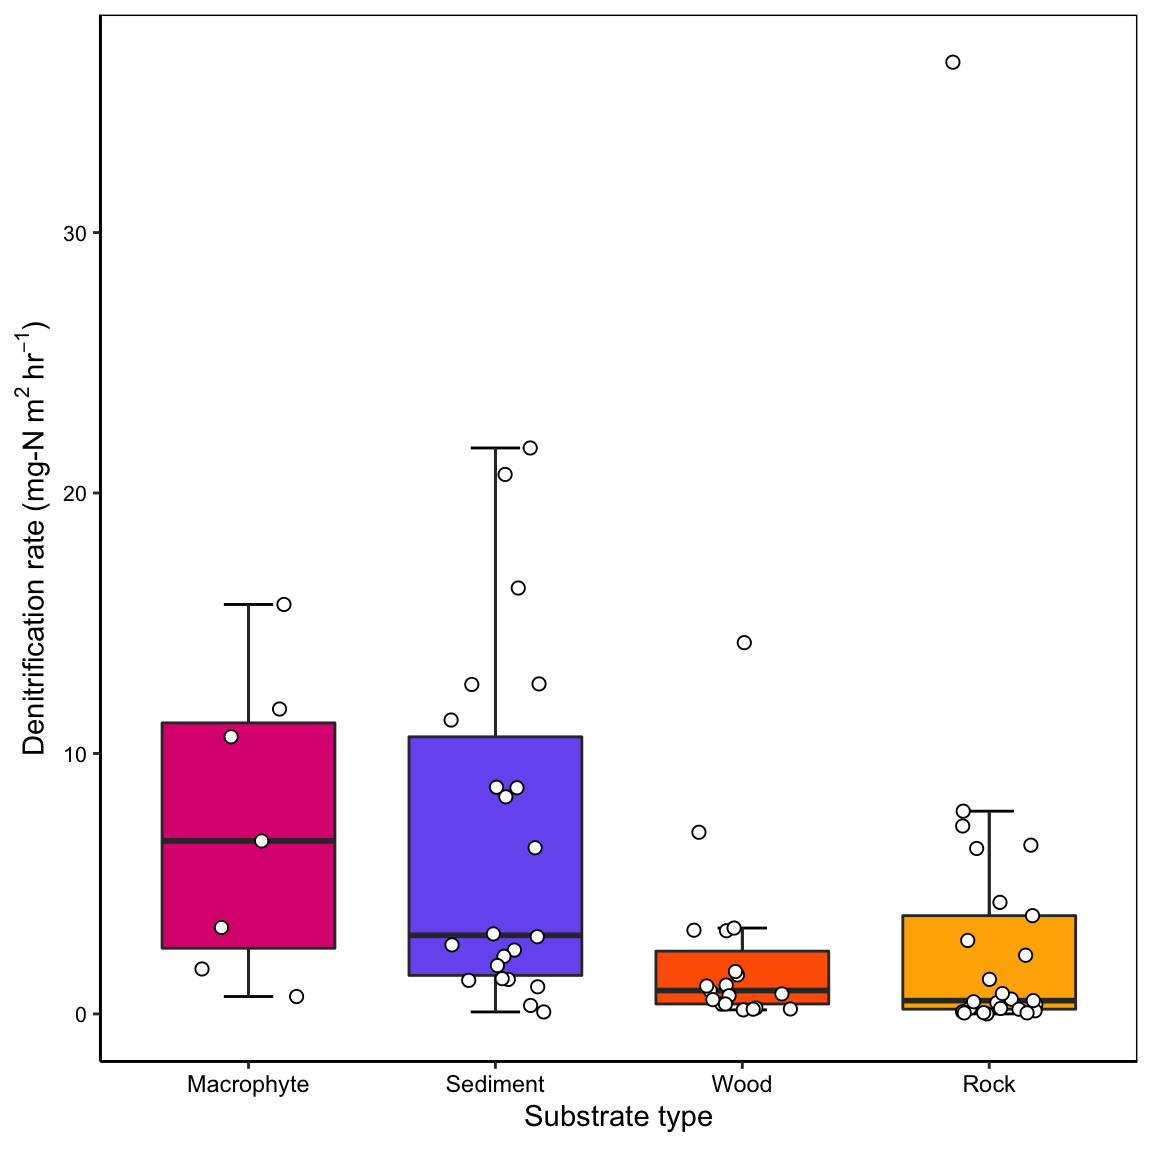
Figure 8: Amended denitrification rates (n = 71) measured on multiple substrates (macrophyte, rock, sediment, wood) present at each study site as part of the Marcarelli Nationwide Survey. Boxplot error bars extend from the first quartile minus 1.5 times the interquartile range to the third quartile plus 1.5 times the interquartile range, middle bar denotes median.
Further directions
Remaining metabolism modeling for Marcarelli Nationwide Survey (n = 24 sites, including 14 NEON Network sites)
Scaling Marcarelli Nationwide chamber rates to whole-stream estimates at NEON sites, using NEON stream morphology data products
Exploring factors that impact the energy production from denitrification in each substrate
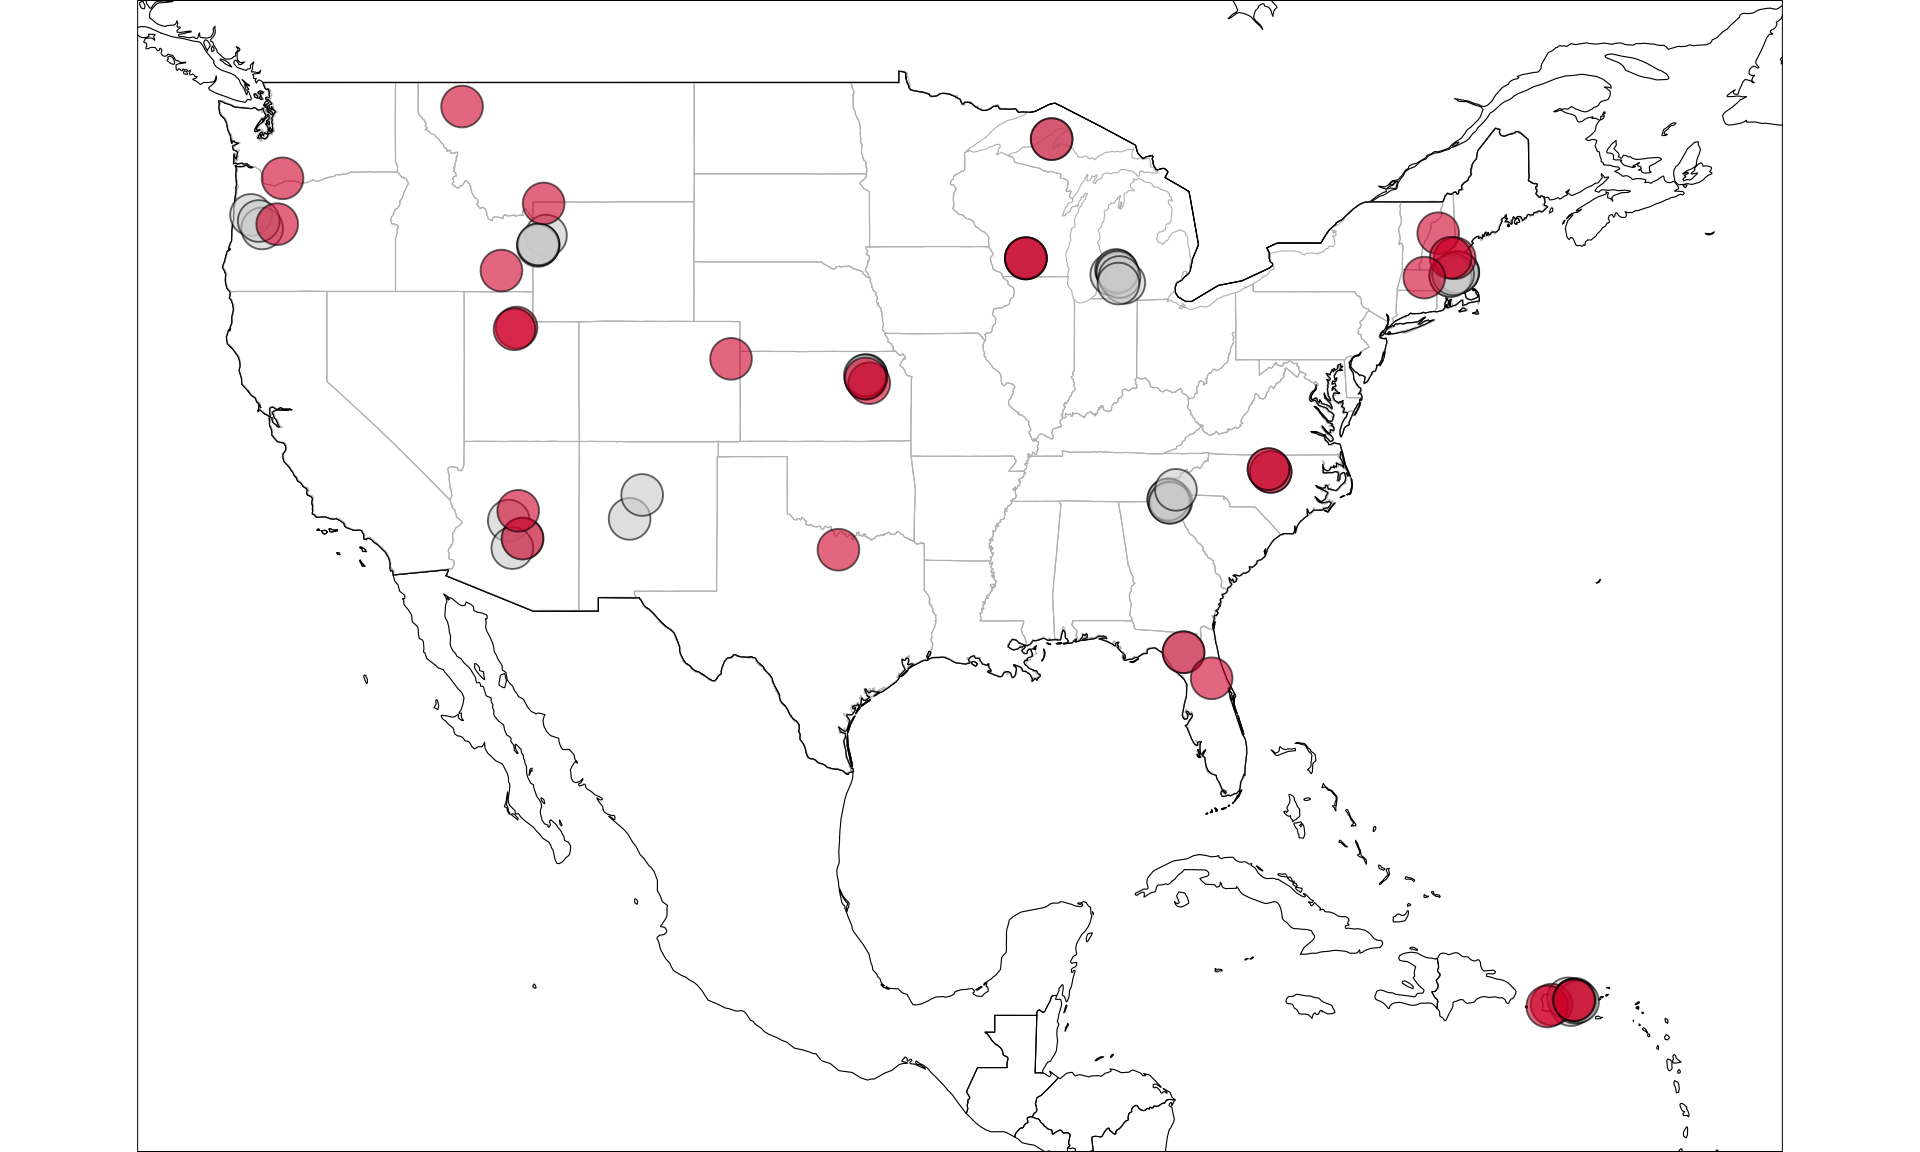
Figure 9: Map of sites used in this current analysis (in grey; Marcarelli Nationwide Survey n = 7, LINX II n = 48) and sites where raw data is available but metabolism has not yet been modeled (in red; Marcarelli Nationwide Survey n = 24).
Supplemental images
Acknowledgments
Marcarelli Nationwide Denitrification and N2 Fixation Survey: We thank C. Allison, A. Copley, J. Cornell, E. Coscarelli, A. Eckersell, H. Harris, D. Larson, J. Ortiz, J. Paris, H. Roose, R. Schipper, and R. Van Goethem for field and laboratory assistance. This research was funded by the National Science Foundation Grant DEB 14-51919 to Amy M. Marcarelli.
Lotic Intersite Nitrogen eXperiment II (LINX-II): Funding for the Lotic Intersite Nitrogen eXperiment II (LINX-II) project was provided by the National Science Foundation Division of Environmental Biology (NSF Grant DEB-0111410). Raw data collected by LINX-II is available from the Environmental Data Initiative repository here: https://doi.org/10.6073/pasta/eac34b6c1cfb0268dd76ef68a7a90bfc. Whole-stream denitrification rates measured using 15-N tracers are from from Mulholland et al. 2009 Supplemental, https://www.doi.org/10.4319/lo.2009.54.3.0666. Modeled metabolism data obtained from Bernot et al. 2010 Supplemental, https://www.doi.org/10.1111/j.1365-2427.2010.02422.x.
StreamPULSE Network: Additional data sets were provided by the StreamPULSE Network, with funding provided by the National Science Foundation Macrosystems program (NSF Grant EF 14-42439). https://data.streamPULSE.org
National Ecological Observatory Network (NEON): We especially thank Kaelin Cawley, Keli Goodman, and Bobby Hensley for their assistance with metabolism modeling efforts. The National Ecological Observatory Network is a program sponsored by the National Science Foundation and operated under cooperative agreement by Battelle Memorial Institute. This material is based in part upon work supported by the National Science Foundation through the NEON Program.
Bernot, Melody J., Daniel J. Sobota, Robert O. Hall Jr, Patrick J. Mulholland, Walter K. Dodds, Jackson R. Webster, Jennifer L. Tank, et al. 2010. “Inter-Regional Comparison of Land-Use Effects on Stream Metabolism.” Freshwater Biology 55 (9): 1874–90. https://doi.org/10.1111/j.1365-2427.2010.02422.x.
Mulholland, Patrick J., Robert O. Hall Jr., Daniel J. Sobota, Walter K. Dodds, Stuart E. G. Findlay, Nancy B. Grimm, Stephen K. Hamilton, et al. 2009. “Nitrate Removal in Stream Ecosystems Measured by 15N Addition Experiments: Denitrification.” Limnology and Oceanography 54 (3): 666–80. https://doi.org/10.4319/lo.2009.54.3.0666.
Mulholland, Patrick J., Ashley M. Helton, Geoffrey C. Poole, Robert O. Hall, Stephen K. Hamilton, Bruce J. Peterson, Jennifer L. Tank, et al. 2008. “Stream Denitrification Across Biomes and Its Response to Anthropogenic Nitrate Loading.” Nature 452 (7184): 202–5. https://doi.org/10.1038/nature06686.
Stumm, Werner, and James J. Morgan. 1996. Aquatic Chemistry: Chemical Equilibria and Rates in Natural Waters. 3rd ed. Environmental Science and Technology. Wiley-Interscience.